AUGMENTED REALITY DATA VISUALIZATION

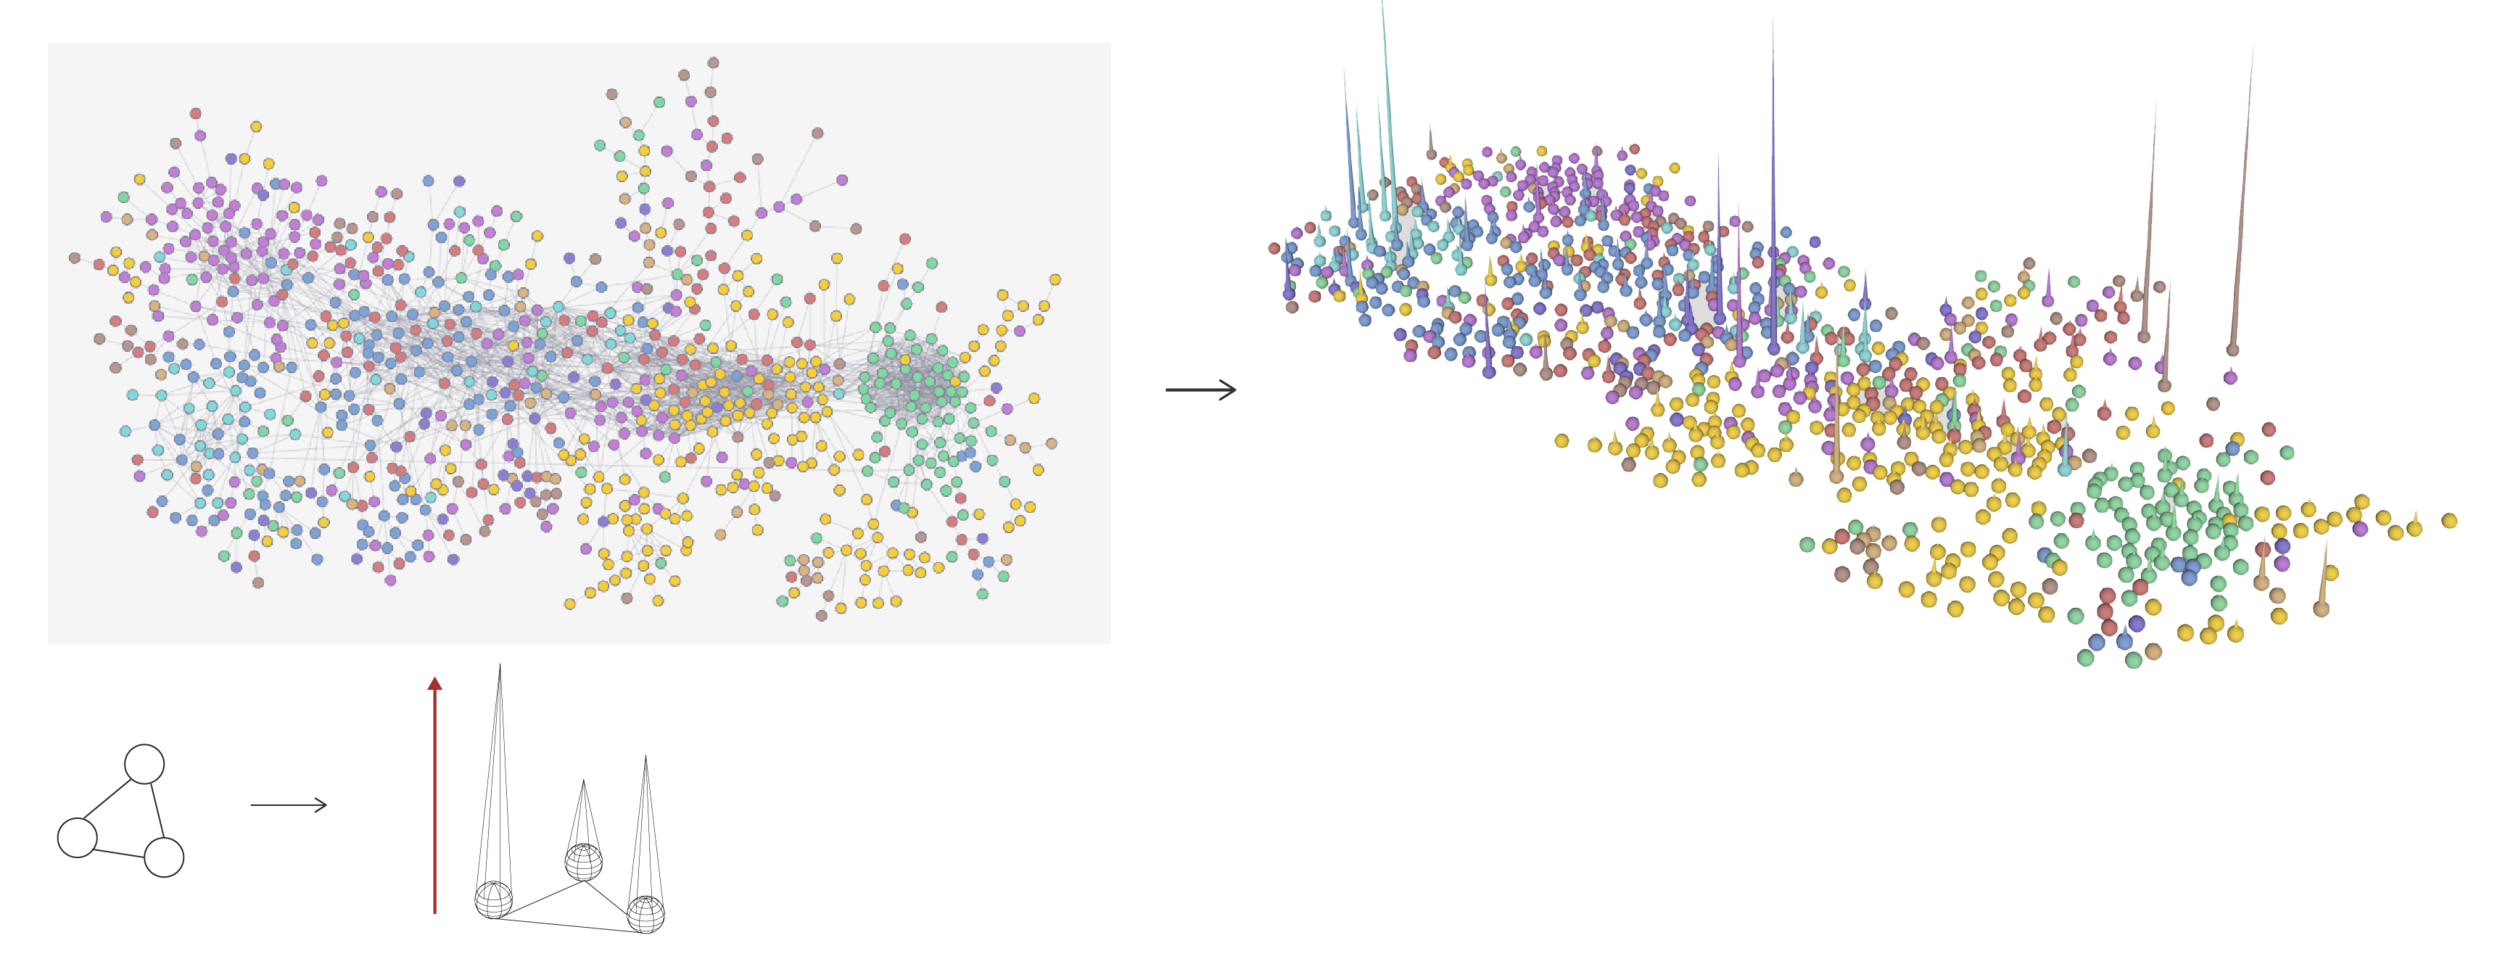
Augmented reality has great potential to present multi-dimensional data in an immersive way. This project experiments with three different types of data visualizations; scatter plot, network graph, and treemap, to explore the ways the AR can enhance the capabilities visualizations.
Besides visualizing multi-dimensional data, AR can also change the way how we interact with printed graphics. Currently, one of the biggest challenges with printed data visualization is that readers cannot interact with the graphs.
This project uses D3.js, Three.js, Unity 3D and Vuforia.